Intraday trading, also known as day trading, involves buying and selling financial instruments within the same trading day. This type of trading requires quick decision-making, as traders aim to capitalize on short-term price movements to make a profit. Intraday traders often use technical analysis and leverage to take advantage of small price fluctuations in the market. It is important for intraday traders to have a solid understanding of market trends, risk management, and trading strategies to be successful in this fast-paced environment.
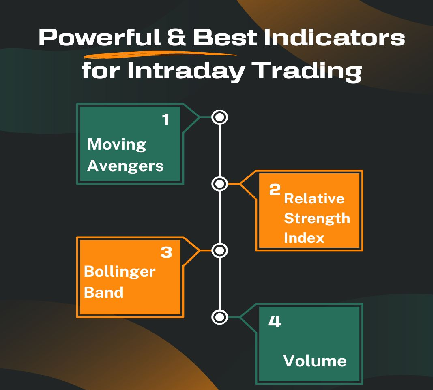
1.Moving Avengers
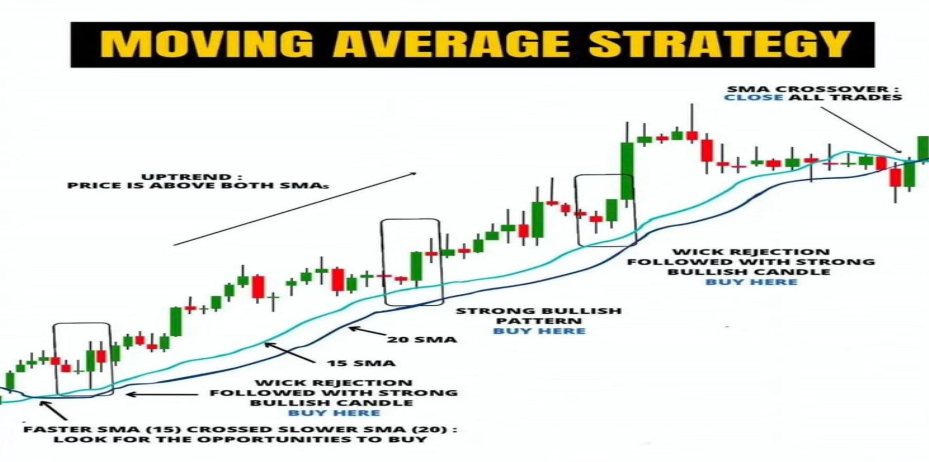
Intraday traders use technical indicators like moving averages to identify potential buy and sell signals and smooth out price data. These indicators help determine trend direction and entry and exit points in fast-moving markets. Traders can use simple, exponential, or weighted moving averages depending on their strategy. Understanding the strengths and limitations of each type is crucial for well-informed trading decisions. Effective use of moving averages improves intraday traders’ chances of success.
The moving average is a widely used indicator in intraday trading that smoother out price fluctuations and helps identify trends. By calculating the average price of a security over a specific time period, moving averages assist traders in determining the trend’s direction and potential entry and exit points. There are various types of moving averages, such as the simple moving average (SMA) and the exponential moving average (EMA), each providing unique insights into market movements.
Each type of moving average, whether it’s simple, exponential, or weighted, has its own advantages and limitations. Some traders prefer the simplicity of the SMA, while others opt for the responsiveness of the EMA. Moreover, weighted moving averages assign greater importance to recent data, making them an ideal choice for traders seeking to swiftly react to changing market conditions. Regardless of the type used, moving averages serve as valuable tools for traders who aim to make well-informed decisions based on price trend analysis.
When interpreting moving average signals for intraday trading, it is crucial to pay attention to crossovers between different moving averages, as they can indicate potential buying or selling opportunities. Additionally, traders can look for the price to either bounce off or break through a moving average, as this confirms a trend. It is also beneficial to use multiple timeframes when analyzing moving averages, as it provides a more comprehensive view of the market trend. By effectively interpreting moving average signals, traders can enhance their chances of executing profitable trades in intraday trading.
2.Relative Strength Index
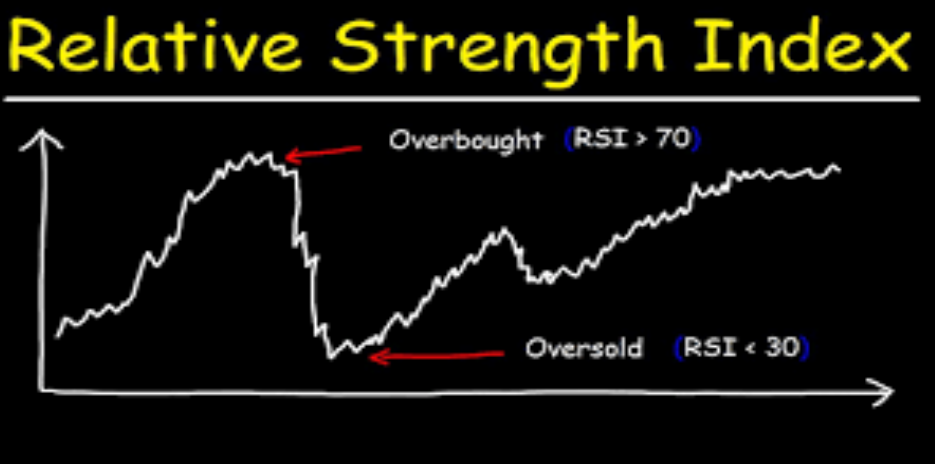
The RSI is an important tool to measure how fast and strong price changes are. It looks at the average gains and losses over a set period, usually 14 days. With values ranging from 0 to 100, readings above 70 indicate overbought conditions, while readings below 30 indicate oversold conditions. By integrating RSI analysis into trading strategies, traders are empowered to pinpoint potential reversals in the market and validate the strength of a trend, ultimately leading to more astute decisions and heightened profitability in intraday trading.
Furthermore, utilizing RSI as a confirming indicator alongside other technical analysis tools like moving averages or trend lines can be a potent strategy in intraday trading. Traders can also leverage RSI to identify divergence with price movements, signaling possible reversals. Additionally, establishing specific RSI thresholds for entry and exit points offers traders clear risk management guidelines. Ultimately, integrating RSI into intraday trading can furnish invaluable insights into market conditions, elevating the likelihood of successful trades.
3.Bollinger Band
Overview of Bollinger Bands Indicator and Its Components:
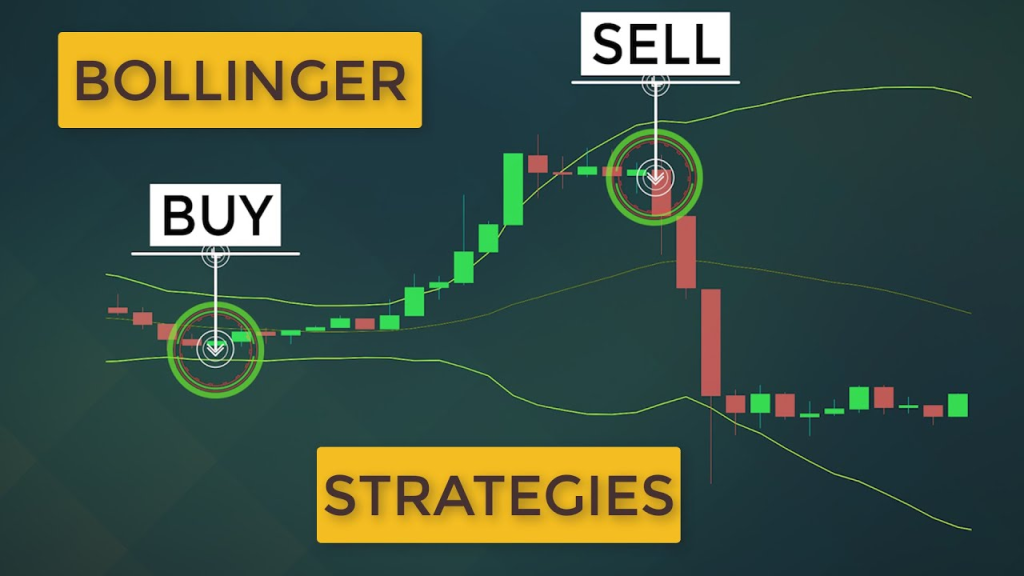
Bollinger Bands is a widely used tool in technical analysis, consisting of three bands: a middle band, an upper band, and a lower band. These bands are constructed based on a moving average and standard deviations of price volatility. Traders find Bollinger Bands valuable for identifying overbought or oversold conditions in the market.
When the price touches or surpasses the upper band, it suggests that the asset may be overbought and due for a correction. Conversely, when the price touches or goes below the lower band, it indicates that the asset may be oversold and due for a rebound. By incorporating Bollinger Bands into their trading strategies, traders gain additional confirmation of potential entry and exit points, and can manage risk more effectively.
Measuring Volatility and Identifying Trend Reversals with Bollinger Bands:
The proximity of the bands is an indicator of volatility, with narrow bands representing low volatility and wider bands representing high volatility. Traders can also look for patterns such as a squeeze in the bands, which signals an imminent breakout. In terms of trend reversals, if the price consistently breaks through the upper or lower band, it may indicate a potential reversal in the current trend. Overall, integrating Bollinger Bands into one’s trading arsenal allows for more informed decisions and adaptability to changing market conditions.
Tips for Setting Bollinger Bands Parameters for Intraday Trading:
When setting Bollinger Bands parameters for intraday trading, it is crucial to consider the timeframe you are trading in. For shorter timeframes, like 5 or 15-minute charts, a common approach is to use a 20-period moving average with bands set at two standard deviations from the average. This configuration aids in capturing short-term price movements and potential reversals more effectively. Additionally, adjusting the parameters to suit the specific market being traded, considering its volatility or lack thereof, can enhance the accuracy of the signals generated by the bands. Conducting experiments with different settings and practicing with a demo account can assist traders in finding the optimal parameters for their intraday trading strategy.
4.Volume
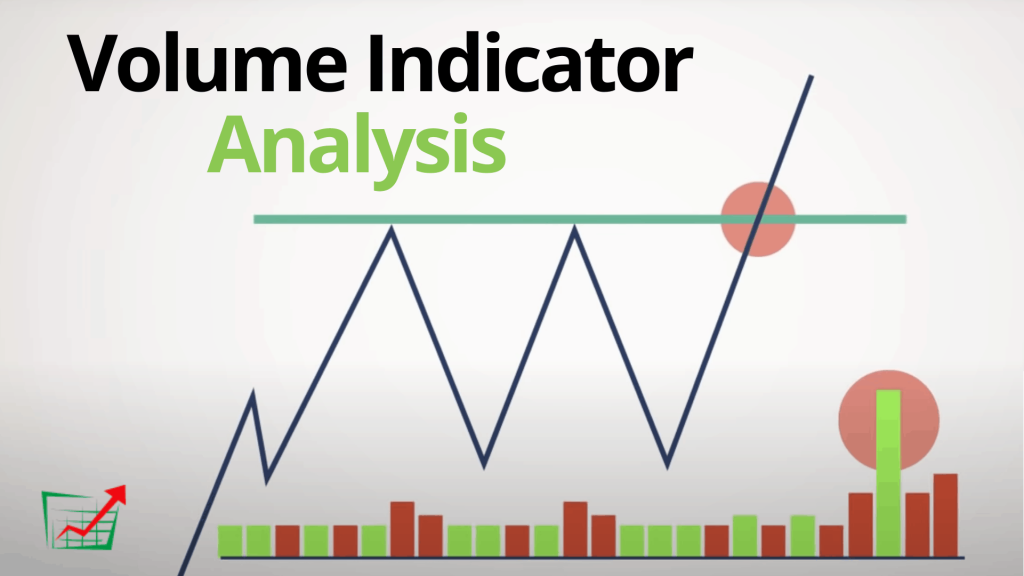
Volume analysis, when combined with Bollinger Bands, confirms trading signals by indicating the strength of price movements. High volume at the upper band suggests overbought security, while low volume at the lower band suggests oversold security. This combination helps traders make informed decisions about entering or exiting trades, gauge market sentiment, and make accurate predictions about future price movements. Incorporating volume analysis into intraday trading strategies maximizes short-term trading opportunities and minimizes losses.
Using volume to confirm price movements and identify potential trend reversals is a powerful technique. Analyzing volume spikes can unveil potential buying or selling opportunities. Pairing volume analysis with other technical indicators can lead to more informed trading decisions. These tools offer traders key insights and strategies to navigate the market effectively and increase their likelihood of success. By integrating them into their trading strategies, traders can gain a deeper grasp of market dynamics and make well-informed decisions based on technical analysis.
Interpreting volume spikes can help traders foresee potential shifts in market sentiment and pinpoint possible entry and exit points. By focusing on both the direction of price movements and the corresponding volume, traders can obtain a more profound understanding of market activity, facilitating more strategic trading decisions. Utilizing volume analysis in combination with other technical indicators can bolster trading signals and enhance the accuracy of predictions. Ultimately, integrating volume analysis into trading strategies can give traders a competitive edge and enhance their overall trading performance.