
Introduction to Candlestick Charts and Their Importance in Trading
Candlestick charts are a fundamental tool in the world of trading, providing valuable insights into market trends and price movements. Understanding Candlestick Charts is essential for any trader looking to make informed decisions based on historical price data and market sentiment.
| Term | Description | Related Terms |
|---|---|---|
| Candlestick Charts | A type of financial chart used to depict the price movements of an asset. Shows open, high, low, and close prices for a specific period. | Technical Analysis, Market Trends |
| Bullish Signal | Indicates potential upward price movement. Suggests buying opportunities. | Green/White Candle, Engulfing Pattern |
| Bearish Signal | Signifies potential downward price movement. Signals selling opportunities. | Red/Black Candle, Hanging Man |
| Munehisa Homma | Tools used in technical analysis to understand the strength of a price movement by analysing the volume traded during a specific period. Used alongside candlestick patterns for more comprehensive insights. | Candlestick History |
| Technical Analysis | The study of past market data, primarily price and volume, to forecast future price movements. Candlestick charts are a crucial tool in this analysis. | Candlestick Charts, Moving Averages |
| Market Sentiments | The overall attitude of investors towards a particular security or financial market. Candlestick charts help to visualize this through patterns. | Buyer Behaviour, Seller Behaviour |
| Price Movements | Buyer Behaviour, Seller Behaviour | Highs and Lows, Open and Close Prices |
| Volume Indicators | Tools used in technical analysis to understand the strength of a price movement by analyzing the volume traded during a specific period. Used alongside candlestick patterns for more comprehensive insights. | Trading Volume, Market Strength |
| Moving Averages | A technical indicator that helps smooth out price data over a specified time frame to identify the direction of the trend. Often used with candlestick charts to enhance analysis accuracy. | Trend Direction, Reversal Points |
| Risk Management | Techniques employed by traders to preserve capital and minimize losses. Involves strategies such as setting stop-loss orders and sizing positions based on asset volatility. | Stop-Loss Orders, Position Sizing |
| Entry and Exit Points | Points at which traders decide to enter or exit a trade based on the signals provided by candlestick patterns and other analyses. Critical for optimizing trading outcomes. | Bullish Engulfing Pattern, Morning Star Formation |
| Advanced Candlestick Patterns | Include complex formations like Three Inside Up/Down and Abandoned Baby, offering more in-depth insights into market sentiments and potential trend reversals for experienced traders. | Three Inside Up, Three Inside Down, Abandoned Baby |
| Trader Psychology | The emotional states influencing trading behaviours. Understanding these emotions is crucial when using candlestick charts for decision-making. | Fear, Greed, Confirmation Bias |
What are Candlestick Charts?
A Brief History
The history of candlestick charts dates back several centuries, with their origin traced to 17th century Japan. The first detailed documentation of candlestick patterns can be attributed to a Japanese businessman named Munehisa Homma in the 18th century. Homma’s pioneering work in technical analysis laid the foundation for the use of candlestick charts as a “seasoned” tool for analysing financial markets. Furthermore, these charts have become commonplace for most traders today, owing to their ability to provide comprehensive information at a glance.
Why Candlestick Charts Matter in Trading
Candlestick charts play a crucial role in technical analysis by visually representing the size of price moves with different colours. Traders utilize these visual representations to make trading decisions based on irregularly occurring patterns that help forecast short-term price directions. Statistical evidence has shown that candlestick patterns predict future price movements accurately only 5.3% of the time, emphasizing the importance of combining them with other confirmations for decision-making.
The Role of Candlestick Charts in Technical Analysis
Understanding Market Sentiments
One significant aspect of candlestick charts is their ability to reflect market sentiments through various patterns and formations. These visual representations assist traders in gauging the emotions driving market movements, thereby aiding them in making educated judgments.
Predicting Price Movements
Candlestick charts are invaluable for predicting price movements based on past patterns. Traders analyse these patterns to determine possible price movement directions, leveraging historical data and statistical probabilities to anticipate market trends effectively.
By delving into the intricacies of candlestick charts explained, traders can gain a more in-depth understanding of market dynamics and enhance their decision-making processes within the realm of technical analysis.
The Basics of Reading Candlestick Charts
Candlestick charts are an essential tool for traders, providing valuable insights into market trends and price movements. Understanding Candlestick Charts is crucial for making informed decisions based on historical price data and market sentiment. In this section, we will explore the anatomy of a candlestick and delve into basic candlestick patterns to gain a comprehensive understanding of how to read candlestick charts for trading.
Anatomy of a Candlestick
The Body and Wicks Explained
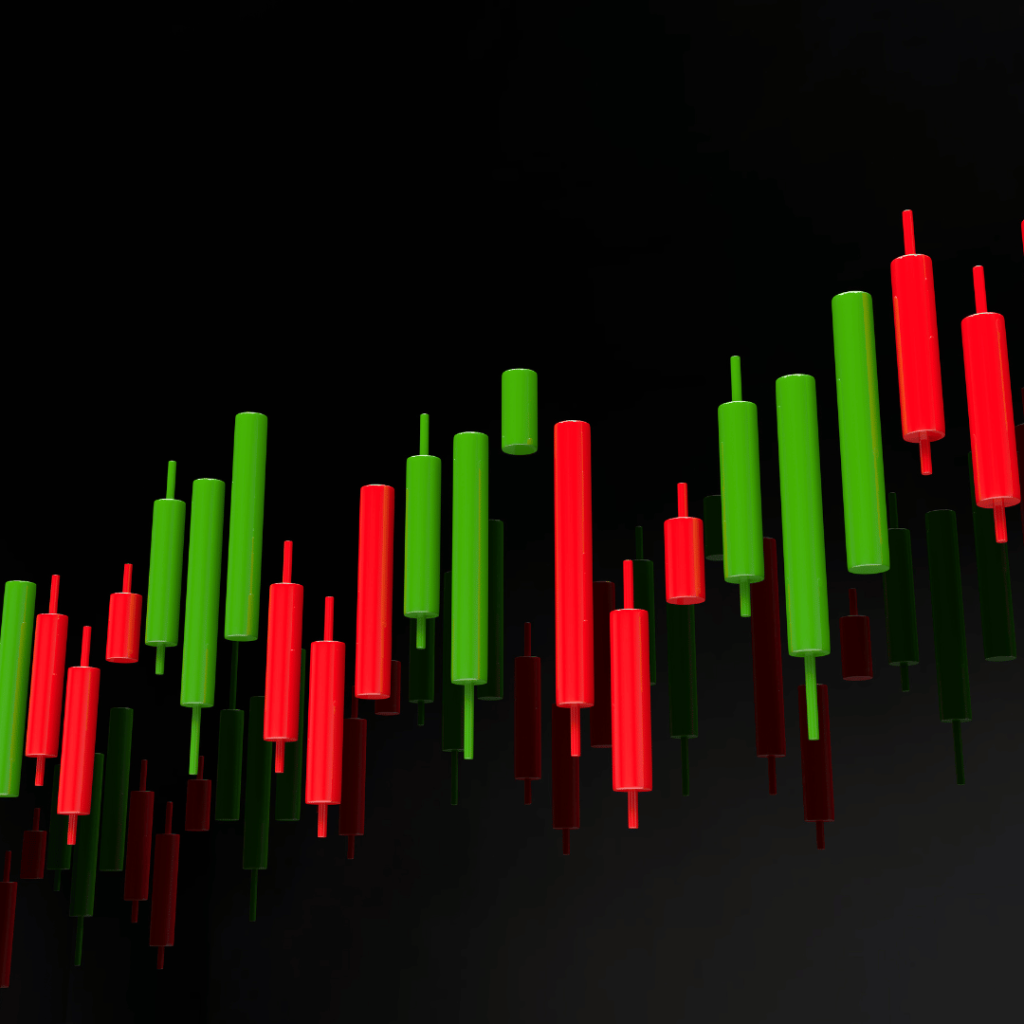
When examining a candlestick chart, each individual candlestick represents the price activity for a specific period, whether it’s one day, one hour, or even one minute. The body of the candlestick illustrates the difference between the opening and closing prices within that timeframe. If the closing price is higher than the opening price, the body is typically displayed as white or green to indicate a bullish market sentiment. Conversely, if the closing price is lower than the opening price, the body is usually represented as black or red, signalling a bearish market sentiment.
Additionally, above and below the body of the candle are thin lines called wicks or shadows. These wicks show the highest and lowest prices reached during that time period. Understanding these components allows traders to interpret buyer and seller behaviour within specific trading blocks effectively.
Colour Significance in Candlesticks
The colour of a candlestick holds significant meaning in technical analysis. As mentioned earlier, white or green candlesticks typically represent bullish market sentiment, indicating upward price movement. On the other hand, black or red candlesticks signify bearish market sentiment, suggesting downward price movement.
It’s important to note that while colour can provide quick visual cues about market sentiment, traders should not rely solely on colour when analysing candlestick patterns. Instead, it’s essential to consider other factors such as volume and trend indicators to make well-informed trading decisions.
Basic Candlestick Patterns and Their Meanings
Single Candlestick Patterns
Single candlestick patterns express vital information needed to make more effective day trading decisions. These patterns describe buyer and seller behaviour within a specific trading block and can help traders spot possible lucrative trading opportunities. Over time, individual candlesticks form patterns that traders can use to recognize major support and resistance levels.
Multi-Candlestick Patterns
In addition to single candlestick patterns, multi-candlestick patterns play a crucial role in technical analysis by providing insight into complex market dynamics. These patterns offer valuable information about shifts in market sentiments and potential trend reversals. Traders can leverage multi-candlestick patterns to identify continuation patterns or moments of market indecision accurately.
Understanding these basic candlestick patterns equips traders with essential tools for recognizing profitable trading opportunities based on historical price data and statistical probabilities.
By mastering these fundamental aspects of reading candlestick charts, traders can develop a comprehensive understanding of market dynamics and enhance their ability to make well-informed trading decisions based on historical price data.
The Art of Technical Analysis Using Candlestick Charts
Candlestick charts serve as a cornerstone for technical analysis, offering valuable insights into market dynamics and price movements. By combining Candlestick Charts with technical indicators, traders can develop a comprehensive understanding of market trends and make well-informed trading decisions.
Combining Candlestick Patterns with Technical Indicators
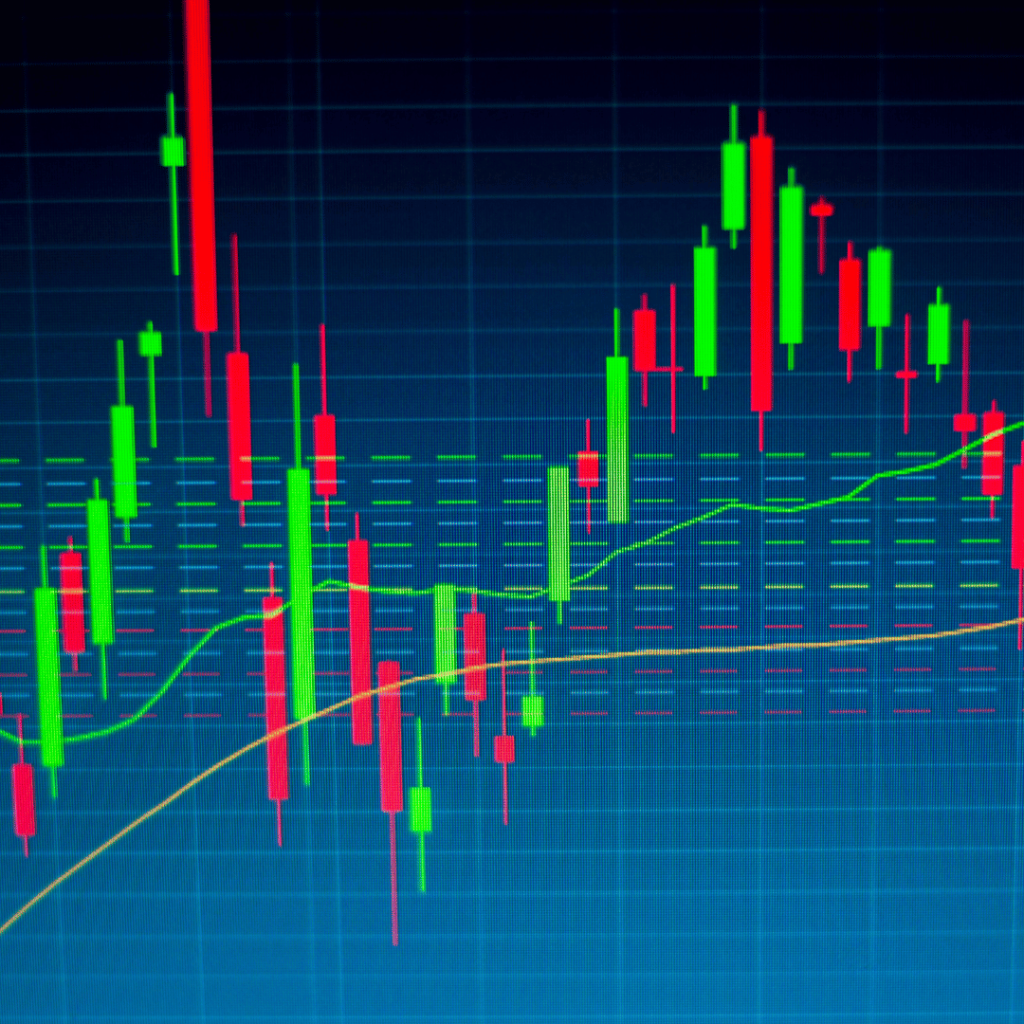
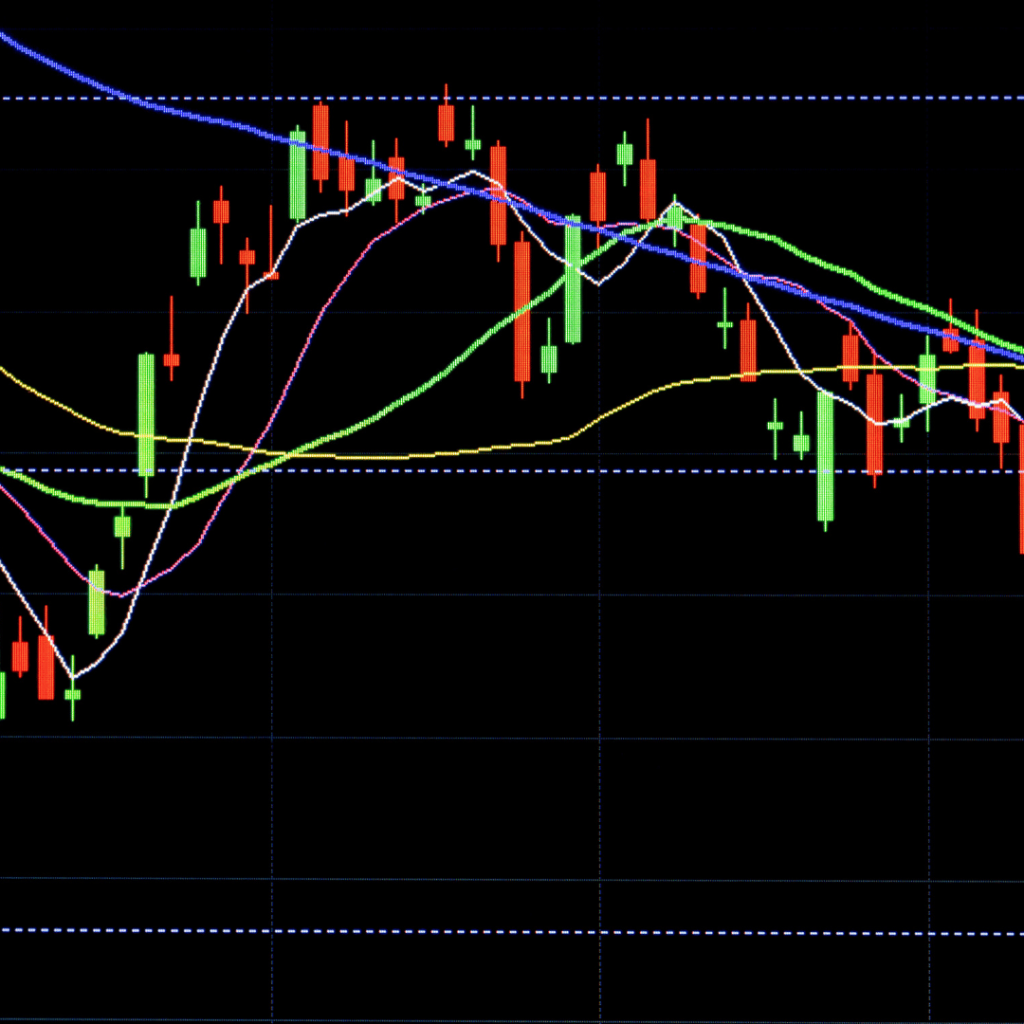
When it comes to technical analysis, combining Candlestick Patterns with other technical indicators enhances the accuracy of market predictions. One such indicator is Moving Averages, which smooth out price data to identify trends over specific time frames. By overlaying moving averages on candlestick charts, traders can gain a clearer perspective on trend direction and potential reversal points.
Volume indicators are also crucial with candlestick patterns. These indicators provide insights into the strength or weakness of a price movement by analysing the volume traded during a specific period. When combined with candlestick patterns, volume indicators offer a more comprehensive view of market sentiment and potential trend shifts.
Developing a Trading Strategy Based on Candlestick Patterns
Crafting an effective trading strategy based on Candlestick Patterns involves incorporating risk management techniques and setting entry and exit points to optimize trading outcomes.
Risk management techniques are essential for preserving capital and minimizing losses. Traders can employ strategies such as setting stop-loss orders to limit potential losses when the market moves against their positions. Additionally, position sizing based on the volatility of the asset being traded is crucial for managing risk effectively.
Setting entry and exit points revolves around identifying optimal moments to enter or exit trades based on candlestick patterns. By leveraging historical price data and statistical probabilities derived from candlestick patterns, traders can establish precise entry points to capitalize on potential price movements. Similarly, defining exit points allows traders to lock in profits or cut losses based on the signals provided by candlestick patterns.
By integrating these elements into their trading strategy, traders can harness the power of Candlestick Charts to make informed decisions and navigate the complexities of financial markets effectively.
How to Make Money Trading with Candlestick Charts
As investors and traders, the ability to identify profitable trading opportunities is crucial for achieving success in the financial markets. Understanding Candlestick Charts and how to leverage them effectively can significantly enhance one’s ability to make informed trading decisions.
Identifying Profitable Trading Opportunities
Bullish vs. Bearish Signals
Candlestick patterns can express vital information needed to make more effective day trading decisions. In a small space, they can describe buyer and seller behaviour within a specific trading block. The patterns they form can help you spot possible lucrative trading opportunities. When analysing candlestick charts, it’s essential to distinguish between bullish and bearish signals. Bullish signals indicate potential upward price movements, suggesting buying opportunities, while bearish signals signify potential downward price movements, signalling potential selling opportunities.
Understanding the nuances of these signals allows traders to interpret possible market trends and form decisions from those inferences. By recognizing these signals, traders can capitalize on favourable market conditions and optimize their trading strategies accordingly.
The Importance of Timing
We looked at five of the more popular candlestick chart patterns that signal buying opportunities. They can help identify a change in trader sentiment where buyer pressure overcomes seller pressure. Such a downtrend reversal can be accompanied by a potential for long gains. Candlestick patterns frequently give off signals of indecision, alerting traders of a potential change in direction.
Timing plays a critical role in maximizing profitability when trading with candlestick charts. It involves identifying optimal entry and exit points based on the signals provided by candlestick patterns. Traders must pay close attention to timing their trades strategically to capitalize on favourable market movements while minimizing potential losses during adverse price fluctuations.
Real-Life Examples of Successful Trades Using Candlestick Charts
My Personal Experience
As a trader, I have personally witnessed the power of candlestick charts in identifying key trends and applying specific formulas to develop accurate predictions. Candlestick analysis has been around for centuries and works for the same reason as other forms of technical analysis: because traders follow it.
One instance that stands out is when I identified a bullish engulfing pattern on a daily chart for a particular stock. This pattern signalled a potential trend reversal from bearish to bullish sentiment, prompting me to enter into a long position based on this compelling signal. As anticipated, the stock exhibited significant upward movement following this pattern formation, resulting in substantial profits from this well-timed trade.
Lessons Learned
Understanding candlestick patterns allowed me to interpret possible market trends and form decisions from those inferences effectively. By leveraging these patterns, I gained valuable insights into market dynamics and developed an intuitive approach towards making well-informed trading decisions based on historical price data.
In terms of pattern recognition and interpretation, candlestick charts have improved and expanded over time. Steve Nison, an American trader who popularized candlestick analysis on Western financial markets, deserves most of the credit for this development.
By sharing my personal experience with successful trades using candlestick charts, I aim to emphasize the practical significance of mastering these powerful tools for achieving consistent success in trading endeavours.
Advanced Techniques in Reading Candlestick Charts
Now that we have covered the basics of reading candlestick charts and their significance in technical analysis, it’s time to delve into more advanced techniques for analysing these essential tools. Advanced candlestick patterns offer experienced traders more profound insights into market dynamics and price movements, providing a comprehensive understanding of complex market behaviours.
Beyond the Basics: Advanced Candlestick Patterns
Complex Patterns for Experienced Traders
Advanced candlestick patterns encompass a wide array of complex formations that require a profound understanding of market dynamics and extensive experience in technical analysis. These patterns go beyond the standard single and multi-candlestick formations, offering intricate insights into market sentiments and potential trend reversals. For instance, patterns like the Three Inside Up, Three Inside Down, and Abandoned Baby are considered advanced due to their complexity and the nuanced information they convey about market trends.
Furthermore, advanced candlestick patterns often involve multiple candlesticks forming specific sequences that indicate significant shifts in buyer and seller behaviour. Traders who have honed their skills in pattern recognition can leverage these complex formations to make well-informed trading decisions based on historical price data and statistical probabilities.
Combining Patterns for Greater Accuracy
Experienced traders often combine multiple advanced candlestick patterns to enhance the accuracy of their market predictions. By analysing how different patterns interact within specific market conditions, traders can gain a more comprehensive understanding of potential price movements and trend reversals. For example, combining the Bullish Engulfing pattern with the Morning Star formation can provide stronger indications of potential upward price movements, leading to more precise entry and exit points for trades.
Moreover, by integrating volume indicators and moving averages with these combined patterns, traders can further refine their analyses and develop robust trading strategies that capitalize on favourable market conditions effectively.
The Psychological Aspect of Trading with Candlestick Charts
In addition to technical analysis, understanding the psychological aspect of trading is crucial when utilizing candlestick charts as a tool for making informed decisions. Trader psychology plays a significant role in shaping market dynamics and influencing individual trading decisions.
Understanding Trader Psychology
Trader psychology encompasses various emotional states such as fear, greed, hope, and regret that significantly impact trading behaviours. Fear often leads to impulsive selling decisions during market downturns, while greed may drive traders to hold on to positions longer than necessary, anticipating higher profits. Understanding these psychological factors allows traders to anticipate potential market movements driven by collective emotions within the trading community.
Moreover, recognizing behavioural biases such as confirmation bias or herd mentality enables traders to approach candlestick chart analysis with a balanced perspective. By acknowledging these psychological influences, traders can make more rational decisions based on factual evidence rather than emotional impulses.
How Emotions Affect Trading Decisions
Emotions heavily influence trading decisions when interpreting candlestick charts. For instance, experiencing a series of losses may lead to heightened anxiety or frustration, prompting impulsive actions that deviate from established trading strategies. Conversely, achieving consecutive wins might result in overconfidence or complacency, leading to increased risk-taking without thorough analysis.
By acknowledging the impact of emotions on decision-making processes when using candlestick charts for technical analysis, traders can adopt disciplined approaches that mitigate emotional biases. Developing mental resilience through mindfulness practices or maintaining strict adherence to predetermined trading plans helps counteract impulsive reactions driven by emotions.
Conclusion
Recap of Key Points
In conclusion, understanding candlestick charts and their significance in technical analysis is crucial for making informed trading decisions. Throughout this comprehensive guide, we have explored the foundational aspects of candlestick charts, delved into the basics of reading these essential tools, and discussed advanced techniques for analysing market dynamics. Here’s a recap of the key points covered:
- Historical Significance: Candlestick charts originated in 17th century Japan and have since become a seasoned tool for analysing financial markets, providing comprehensive information at a glance.
- Role in Technical Analysis: Candlestick charts play a crucial role in technical analysis by reflecting market sentiments and predicting price movements based on past patterns.
- Anatomy and Patterns: Understanding the anatomy of a candlestick, including the body, wicks, and colour significance, equips traders with essential tools for recognizing profitable trading opportunities based on historical price data.
- Technical Analysis Integration: Combining candlestick patterns with technical indicators such as moving averages and volume indicators enhances the accuracy of market predictions and aids in developing effective trading strategies.
- Profitable Trading Opportunities: Identifying bullish vs. bearish signals and emphasizing the importance of timing are essential for maximizing profitability when trading with candlestick charts.
- Real-Life Examples: Personal experiences and successful trades using candlestick charts emphasize the practical significance of mastering these powerful tools for consistent success in trading endeavours.
- Advanced Techniques: Advanced candlestick patterns offer experienced traders more profound insights into market dynamics, providing a comprehensive understanding of complex market behaviours. Additionally, understanding trader psychology is crucial when utilizing candlestick charts as a tool for making informed decisions.
Encouragement to Practice and Continue Learning
As investors or traders looking to navigate the complexities of financial markets effectively, it’s imperative to practice interpreting candlestick charts diligently. Like any other technical analysis tool, they provide an extra layer of analysis on top of fundamental analysis that forms the basis for trading decisions. By continuously honing your skills in pattern recognition and interpretation through real-time market observation, you can develop an intuitive approach towards making well-informed trading decisions based on historical price data.
Moreover, every chart candlestick pattern you learn will be valuable if you rely on technical analysis to predict price movements in stock, commodity, or forex trading. Nonetheless, it’s essential to use other technical analysis tools to confirm trades. These include Fibonacci support and resistance levels, technical indicators like moving averages or volume indicators, trend lines, among others.
In essence, mastering the art of reading candlestick charts requires dedication to continuous learning and adapting to evolving market conditions. Embracing a disciplined approach while integrating both fundamental and technical analyses empowers traders to make well-informed decisions that align with their long-term financial goals.
By staying committed to refining your skills in interpreting candlestick patterns alongside other technical analysis tools, you can enhance your ability to navigate dynamic market environments confidently while optimizing trading outcomes effectively.


