
What is a Trading Indicator on TradingView?

A Trading Indicator on TradingView is a mathematical tool that helps traders understand price movements on charts. It provides signals for buying or selling, setting entry and exit points, and assessing market momentum. TradingView offers a variety of indicators, including Moving Averages and Oscillators, that can be customized to fit different trade strategies and improve success chances.
1 – Moving Average (MA)
The Moving Average (MA) indicator is renowned for its simplicity and effectiveness in identifying trends. It is often the tool of choice for traders across different markets. Serving as a practical resource, it allows traders to spot market trends and potential reversal points in price movement. By calculating the average trading price over a selected period, it provides valuable information that smooths out the erratic price changes represented on the chart.

Traders do not solely rely on the MA (Moving Average) to validate trend directions. They also utilize it to pinpoint areas where prices are likely to encounter support or resistance. These critical levels trigger buying or selling alerts for their trades. By examining the position of the prevailing market price in relation to the MA line, traders gain a clearer perspective on potential future movements. This valuable insight empowers them to make well-informed trade decisions.
2 – Relative Strength Index (RSI)

Although the Relative Strength Index (RSI) indicator is less commonly used for overall trend analysis compared to the more flexible Moving Averages, it is highly popular for its clear overbought and oversold signals. This technical indicator measures the magnitude and velocity of price changes in an asset, providing valuable trading insights into potential reversal points. With a range from 0 to 100, values above 70 indicate overbought trading conditions, while values below 30 indicate oversold trading conditions.
3 – Moving Average Convergence Divergence (MACD)
The Moving Average Convergence Divergence (MACD) Indicator is an important tool used by traders to identify potential buy and sell signals in financial markets. While it may be slightly less obvious than the RSI, the MACD is highly effective in indicating an asset’s trend and momentum. This oscillator is composed of two lines:
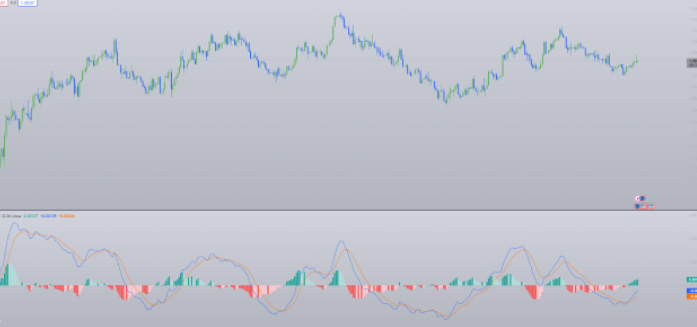
the MACD line, which represents the difference between two moving averages, and the signal line, a moving average of the MACD line. By observing the MACD line crossing above the signal line, traders can identify the optimal bullish signal. Conversely, a bearish signal is signaled when the MACD line crosses below the signal line. To gain further insights into the strength of market trends, traders can also refer to the MACD histogram, which displays the difference between the MACD line and the signal line.
4 – Bollinger Bands
Expanding the range of tools available to traders for market analysis, the Bollinger Bands indicators stand out as visually striking and adaptable trading indicators on TradingView. They are often favored for their ability to encapsulate price volatility and identify trends in a way that complements the momentum-focused MACD and the simplicity of the RSI.

This indicator comprises three lines that overlay the trading price chart – with a simple moving average (SMA) at its core, and the surrounding two lines charting the SMA’s standard deviations. These outer bands dynamically adjust according to the market’s enthusiasm, expanding with extreme volatility and narrowing when things settle down. This provides some of the best indications of extremes in volatility.
5 – Volume
IIn contrast to the vibrant visualization of volatility and trend direction offered by Bollinger Bands, Volume indicators on TradingView play a vital role in confirming the momentum and conviction behind price movements. They add an extra dimension to the refined strategies of technical analysis, which already utilize Bollinger Bands, MACD, RSI, and other top indicators. These tools are indispensable for validating the strength of price movements. However, it is important to note that they are meant to complement, rather than replace, the trend and momentum indications provided by Bollinger Bands.

The Volume Indicator is a straightforward tool that displays the trade activity for a specific financial instrument over a specified time period. By examining the buying and selling pressure, traders can effectively analyze the strength and stability of price movements. Through the presentation of volume bars beneath price charts, traders can identify periods of heightened or diminished activity, which can signify trends or reversals.
6 – Stochastic Oscillator
Volume tools are essential for validating trading ideas by assessing market participation levels. The Stochastic Oscillator complements this data by focusing on momentum and evaluating overbought and oversold trading conditions. This nuanced approach offers traders on TradingView a comprehensive view of potential price reversals.

By comparing the closing price of a security to its price range over a specific period, typically 14 days, the Stochastic Oscillator helps traders identify overbought and oversold levels in the market. Consisting of two fluctuating lines, %K and %D, ranging from 0 to 100, this indicator is a valuable tool for identifying potential reversal points and generating buy or sell signals. When %K crosses above %D in the oversold region, it suggests a buy signal, while a cross below %D in the overbought region indicates a sell signal.
7 – Fibonacci Retracement
The Stochastic Oscillator indicator grants traders the ability to assess potential turning points in the market by analyzing momentum. Another highly regarded and complementary indicator on TradingView is the Fibonacci Retracement Indicator, which presents traders with valuable insights regarding potential areas of support and resistance. Inspired by the renowned Fibonacci sequence, where each number is the sum of the previous two, this tool effectively charts significant levels. These levels indicate potential regions where the market may reverse its current trend, leading to a pullback or stabilization.

What sets this indicator apart is its exceptional value in providing precise and measurable levels. Traders can utilize these levels to precisely adjust stop-loss orders, determine profit targets, and seize optimal entry points into the market.
8 – Average True Range (ATR)
Building upon the usefulness of the Fibonacci Retracement’s ability to define crucial support and resistance levels, we now introduce the Average True Range indicator (ATR). Although it may be slightly less popular, this pivotal tool provides invaluable insights into market volatility, further enhancing a trader’s trading strategy. The ATR indicator is ideal for analyzing an asset’s volatility over a specific timeframe. While it may not be frequently used as a standalone indicator, it offers crucial information about the potential extent of price fluctuations. Consequently, it becomes an essential tool for determining optimal stop-loss orders, selecting the appropriate trade size, and identifying moments when the price may deviate significantly from its customary range.

By calculating the average of the largest price range between the highest and lowest points within the current period, the ATR captures the distance between the current low and the previous close. This insight provides traders with a clearer understanding of an asset’s price variability – a vital piece of information when devising profitable trade strategies.
9 – Parabolic SAR
The Parabolic SAR indicator, short for Stop and Reverse, provides clear trading trend signals, yet its role is often overshadowed by the ATR’s crucial volatility analysis in risk management. However, its effectiveness as a straightforward and powerful indicator is undeniable – traders commonly rely on it to pinpoint shifts in market momentum. It distinguishes itself by placing dots that indicate the current trajectory of the trend, whether it’s ascending or descending. As prices fluctuate, these dots move, forming a parabolic shape to accurately track market movements.
Here’s what it looks like:

The Parabolic SAR Indicator is an invaluable tool for traders, providing a wealth of clear and precise trading signals to guide their actions in the market. By closely monitoring the position of the dots relative to the candlesticks, traders can confidently decide when to enter or exit the market.The Parabolic SAR Indicator is highly valuable for traders as it provides them with precise trading signals, guiding them when to enter or exit the market. By examining the position of the dots in relation to the candlesticks, traders can easily determine whether the market is experiencing an upward climb or a downtrend. When the dots are positioned below the candlesticks, it indicates an upward trend, whereas dots placed above suggest a downward movement. These straightforward and reliable signals are incredibly useful for setting up stop-loss orders and identifying potential pivot points in price action. If you want to explore further details about the Parabolic SAR Indicator, you can find comprehensive information on TradingView’s platform.
10 – Ichimoku Cloud
The Ichimoku Cloud indicator, despite its complexity, remains an invaluable tool for traders seeking comprehensive market analysis. While it may present a steeper learning curve in comparison to more straightforward indicators like the Parabolic SAR, its multifaceted approach provides a wealth of insights into market behavior. By revealing prevailing trends, potential support and resistance areas, and indications of impending trend reversals, the Ichimoku Cloud empowers traders with a holistic understanding of market dynamics. This all-encompassing indicator, characterized by a distinct cloud-like formation, proves itself indispensable for informed decision-making in trading.
Here’s a snapshot:

Traders analyze the correlations among the various elements of the Ichimoku Cloud in order to gauge optimal entry and exit points for trades.
Traders who use the Ichimoku Cloud look for price movements above the Cloud to indicateTraders who use the Ichimoku Cloud look for price movements above the Cloud to buy and below it to sell. When the price is within the Cloud, it suggests that the price remains the same. The color of the Cloud also gives insights into the market direction. A green Cloud, where the Leading Span A is above the Leading Span B, indicates an uptrend, while a red Cloud indicates a downtrend. The Cloud can also help traders anticipate future support or resistance areas, looking ahead 26 days.
Besides finding entry and exit points, traders can use these insights to set up stop-loss orders and manage risks. The lines of the Cloud also provide clues about the overall market sentiment. What’s special about this indicator is how it combines different elements of market analysis into one system, making it easier for traders to make informed decisions and predict market movements accurately.


