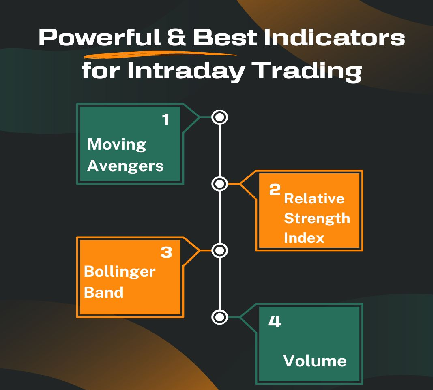
1.Moving Avengers
Intraday traders use technical indicators like moving averages to identify potential buy and sell signals and smooth out price data. These indicators help determine trend direction and entry and exit points in fast-moving markets. Traders can use simple, exponential, or weighted moving averages depending on their strategy. Understanding the strengths and limitations of each type is crucial for well-informed trading decisions. Effective use of moving averages improves intraday traders’ chances of success.
Moving averages are a fundamental aspect of swing trading, widely used to identify trends and determine entry and exit points. The simple moving average (SMA) and the exponential moving average (EMA) are the most popular types used in this strategy. Traders often employ a combination of moving averages to confirm trends and make well-informed trading choices.
The simple moving average (SMA) calculates the average price of a security over a specific time period, creating a smooth line that aids in identifying support and resistance levels. Conversely, the exponential moving average (EMA) assigns more weight to recent price data, making it more responsive to market changes. Through the use of both SMAs and EMAs, traders can gain a clearer understanding of the overall trend and make improved decisions regarding trade entry and exit points.
The EMA is especially valuable for traders seeking to swiftly respond to market fluctuations and exploit short-term opportunities. By integrating both the SMA and EMA into their analysis, traders can leverage the strengths of each indicator and enhance their trading decisions with greater knowledge. Ultimately, mastering the effective use of moving averages can significantly enhance a trader’s capacity to navigate the dynamic and constantly evolving financial markets.
2.Relative Strength Index
The Relative Strength Index (RSI) is a momentum oscillator used by intraday traders to measure the speed and change of price movements. When combined with moving averages, it confirms trends and potential entry or exit points, identifying overbought or oversold conditions. This analysis helps traders make informed decisions and improves the success of their intraday trading strategies, ranging from 0 to 100.
The Moving Average Convergence Divergence (MACD) and the Relative Strength Index (RSI) are two valuable technical indicators that traders can use to complement their moving average analysis. The MACD assists traders in identifying changes in momentum and potential trend reversals, while the RSI acts as a momentum oscillator that can highlight overbought or oversold conditions in the market. By combining these indicators with moving averages, traders can gain a more comprehensive understanding of market dynamics and make more strategic trading decisions. Ultimately, mastering the use of these tools can offer traders a competitive edge in maneuvering the fast-paced and unpredictable world of financial markets.
Moreover, integrating the RSI with other indicators for confirmation can further enhance the accuracy of trading signals. For instance, traders might choose to wait for the RSI to indicate overbought conditions before entering a short position, particularly if the MACD is also signaling a potential trend reversal. By utilizing multiple indicators in conjunction with one another, traders can mitigate the risk of false signals and increase the likelihood of executing profitable trades. This approach to technical analysis demands patience and discipline, but the potential rewards can undoubtedly outweigh the effort invested.
3.Bollinger Band
Bollinger Bands are a technical analysis tool used by intraday traders to assess potential price movements. They consist of a simple moving average and two standard deviations plotted above and below it. When the price touches the upper band, it suggests overbought conditions, while the lower band suggests oversold conditions. When used with RSI, Bollinger Bands provide a comprehensive framework for analyzing price movements and identifying optimal trading opportunities.
Utilizing Bollinger Bands to detect volatility levels and potential trading opportunities can significantly enhance a trader’s decision-making ability. For example, when a stock price reaches the upper Bollinger Band, it may indicate that the stock is overbought and due for a correction. Conversely, if the price reaches the lower band, it may suggest that the stock is oversold and primed for a rebound. By combining Bollinger Bands with other technical indicators, traders can acquire a more comprehensive grasp of market conditions and elevate their overall trading strategy.
Implementing trading strategies that incorporate Bollinger Bands empowers traders to pinpoint potential entry and exit points with heightened accuracy. Moreover, by incorporating additional tools like moving averages or volume indicators, traders can validate signals generated by Bollinger Bands and amplify the probability of successful trades. Traders must exercise prudence by continuously monitoring market conditions and adapting their strategies to navigate shifting trends and seize new opportunities. Ultimately, harnessing the power of Bollinger Bands in synergy with other technical analysis tools equips traders to navigate the intricacies of the market and augment their chances of achieving profitability.
4.Volume
Volume analysis, when combined with Bollinger Bands, confirms trading signals by indicating the strength of price movements. High volume at the upper band suggests overbought security, while low volume at the lower band suggests oversold security. This combination helps traders make informed decisions about entering or exiting trades, gauge market sentiment, and make accurate predictions about future price movements. Incorporating volume analysis into intraday trading strategies maximizes short-term trading opportunities and minimizes losses.
Using volume to confirm price movements and identify potential trend reversals is a powerful technique. Analyzing volume spikes can unveil potential buying or selling opportunities. Pairing volume analysis with other technical indicators can lead to more informed trading decisions. These tools offer traders key insights and strategies to navigate the market effectively and increase their likelihood of success. By integrating them into their trading strategies, traders can gain a deeper grasp of market dynamics and make well-informed decisions based on technical analysis.
Interpreting volume spikes can help traders foresee potential shifts in market sentiment and pinpoint possible entry and exit points. By focusing on both the direction of price movements and the corresponding volume, traders can obtain a more profound understanding of market activity, facilitating more strategic trading decisions. Utilizing volume analysis in combination with other technical indicators can bolster trading signals and enhance the accuracy of predictions. Ultimately, integrating volume analysis into trading strategies can give traders a competitive edge and enhance their overall trading performance.
5.Support & Resistance
The core principles of technical analysis—support and resistance—also serve as a remarkable mnemonic for supply and demand. This simple technical indicator consists of two lines:
• The support line represents the unlikely lower price point of a security.
• The resistance line signifies the price level at which it becomes arduous for the security to surpass.
6.Stochastic Oscillator
By combining the Stochastic Oscillator with other indicators such as moving averages or trendlines, traders can increase the accuracy of their signals and make more informed decisions. Additionally, understanding the concept of divergence in Stochastic Oscillator analysis can help traders anticipate potential trend reversals and take advantage of market opportunities. Overall, mastering the use of the Stochastic Oscillator can greatly enhance a trader’s ability to identify profitable entry and exit points in the market.
The Stochastic Oscillator is a powerful tool for identifying trend reversals and overbought/oversold conditions. The %K line tracks the current price in relation to the highest and lowest prices over a specified period, while the %D line, a moving average of the %K line, provides a clearer signal of potential trend reversals by smoothing out fluctuations. Traders can leverage the Stochastic Oscillator to pinpoint overbought or oversold markets, signaling potential reversals in the current trend. When combined with Bollinger Bands, these signals offer traders the opportunity to make more informed decisions and improve their overall trading success.
When setting up Stochastic Oscillator for swing trading, it is crucial to tailor the parameters to the specific timeframe and asset being traded. Shorter timeframes may require heightened sensitivity to price changes, whereas longer timeframes may benefit from a smoother %D line. To avoid false positives, traders should also consider using other technical indicators in conjunction with the Stochastic Oscillator to confirm signals. Ultimately, mastering the use of the Stochastic Oscillator can significantly enhance a trader’s ability to identify potential market opportunities and increase profitability.
7.OBV(On Balance Volume)
On-balance volume (OBV) is one of the best technical indicators for swing trading and a simple yet effective momentum indicator. OBV adds up the volume on days where the price increased and subtracts volume on days where the price decreased. The rationale behind this method is that volume precedes price movements.
• Increasing OBV is a sign that buying pressure is prevailing
• Decreasing OBV is a sign that selling pressure is stronger
8.MACD(Moving Avenge Convergence Divergence)
The MACD histogram provides traders with additional insight into market momentum, allowing them to confirm trends and make more confident trading decisions. By combining these two technical analysis tools, traders can develop a comprehensive and strategic approach to trading that increases their chances of success in the stock market. The synergy between Fibonacci Retracement and MACD histogram can help traders navigate the complexities of the market with greater precision and efficiency.
9.Fibonacci Retracement
Fibonacci sequence to identify key levels where a security may reverse its trend. By combining Fibonacci retracement levels with other technical indicators, traders can increase the probability of successful trades. When price action confirms a potential reversal at a Fibonacci retracement level, traders can enter positions with confidence and set appropriate stop-loss orders to manage risk. Overall, Fibonacci retracement is a powerful tool that can help traders anticipate market movements and make informed trading decisions.
Using Fibonacci Retracement to identify potential support and resistance levels is a valuable tool in a trader’s arsenal. By understanding Fibonacci levels and applying Fibonacci Retracement, traders can precisely identify crucial areas where price may reverse or continue its trend. This enhances a trader’s ability to make informed decisions about when to enter or exit a trade, ultimately improving their overall success rate. When combined with the Stochastic Oscillator and other technical indicators, Fibonacci Retracement can provide a comprehensive analysis of the market, giving traders a competitive edge in their trading strategies.
Combining Fibonacci Retracement with other indicators for confirmation can significantly increase the accuracy of trade signals and reduce the risk of false signals. Waiting for multiple indicators to align before making a trade can instill more confidence in traders’ decisions, helping them avoid entering trades based on a single misleading indicator. Overall, leveraging Fibonacci Retracement alongside other technical tools can enhance a trader’s ability to navigate the complex and ever-changing financial markets successfully.
10.Avenger True Range(ATR)
Average True Range (ATR) indicator, traders can determine the appropriate distance for setting stop-loss levels based on the volatility of the market. This dynamic approach to risk management can help traders adapt to changing market conditions and optimize their trading strategy for long-term success. By combining ATR with other risk management techniques, traders can create a comprehensive plan that maximizes profitability while minimizing potential downside.
Using ATR to measure volatility and set stop-loss levels has become an essential tool for traders. By incorporating ATR into risk management strategies, traders can gain valuable insights into market dynamics and make more informed decisions. The ability to accurately interpret ATR levels enables traders to adjust their trading positions accordingly, ensuring they stay ahead of the curve in their trading endeavors.
Furthermore, setting stop-loss levels based on ATR can prove advantageous in protecting capital and minimizing losses. By utilizing ATR to determine the appropriate level for stop-loss orders, traders establish a systematic approach to risk management. This not only helps traders avoid making emotional decisions but also allows them to remain disciplined and committed to their trading plan. As a result, traders achieve more consistent and profitable trading outcomes.
Incorporating ATR into trading strategies is a powerful way to enhance one’s ability to navigate the complexities of the financial markets. With a deeper understanding of market volatility and a structured risk management approach, traders are well-equipped to achieve long-term success. By harnessing the power of ATR, traders can confidently navigate the financial markets and optimize their trading potential.
Conclusion
In conclusion, by incorporating technical indicators such as ATR, Ichimoku Cloud, and Parabolic SAR into a trading plan, traders can gain valuable insights into market trends, support and resistance levels, and optimal entry and exit points. These tools can help traders make more informed decisions and improve their overall trading performance. By understanding and utilizing these indicators effectively, traders can enhance their chances of success in the financial markets and achieve their long-term trading goals.
Ultimately, the combination of ATR, Ichimoku Cloud, and Parabolic SAR can provide traders with a comprehensive analysis of market conditions and potential opportunities. By using these indicators in conjunction with other tools and strategies, traders can better identify high-probability trades and manage risk effectively. It is essential for traders to continuously educate themselves on the use of these indicators and adapt their trading plan accordingly to stay ahead in the ever-changing financial markets. With dedication and practice, traders can leverage these indicators to improve their trading performance and achieve consistent profits in the long run.